Markdown Graphs
You can add graphs to your presentation by leveraging code blocks and specifying mermaid as the language:
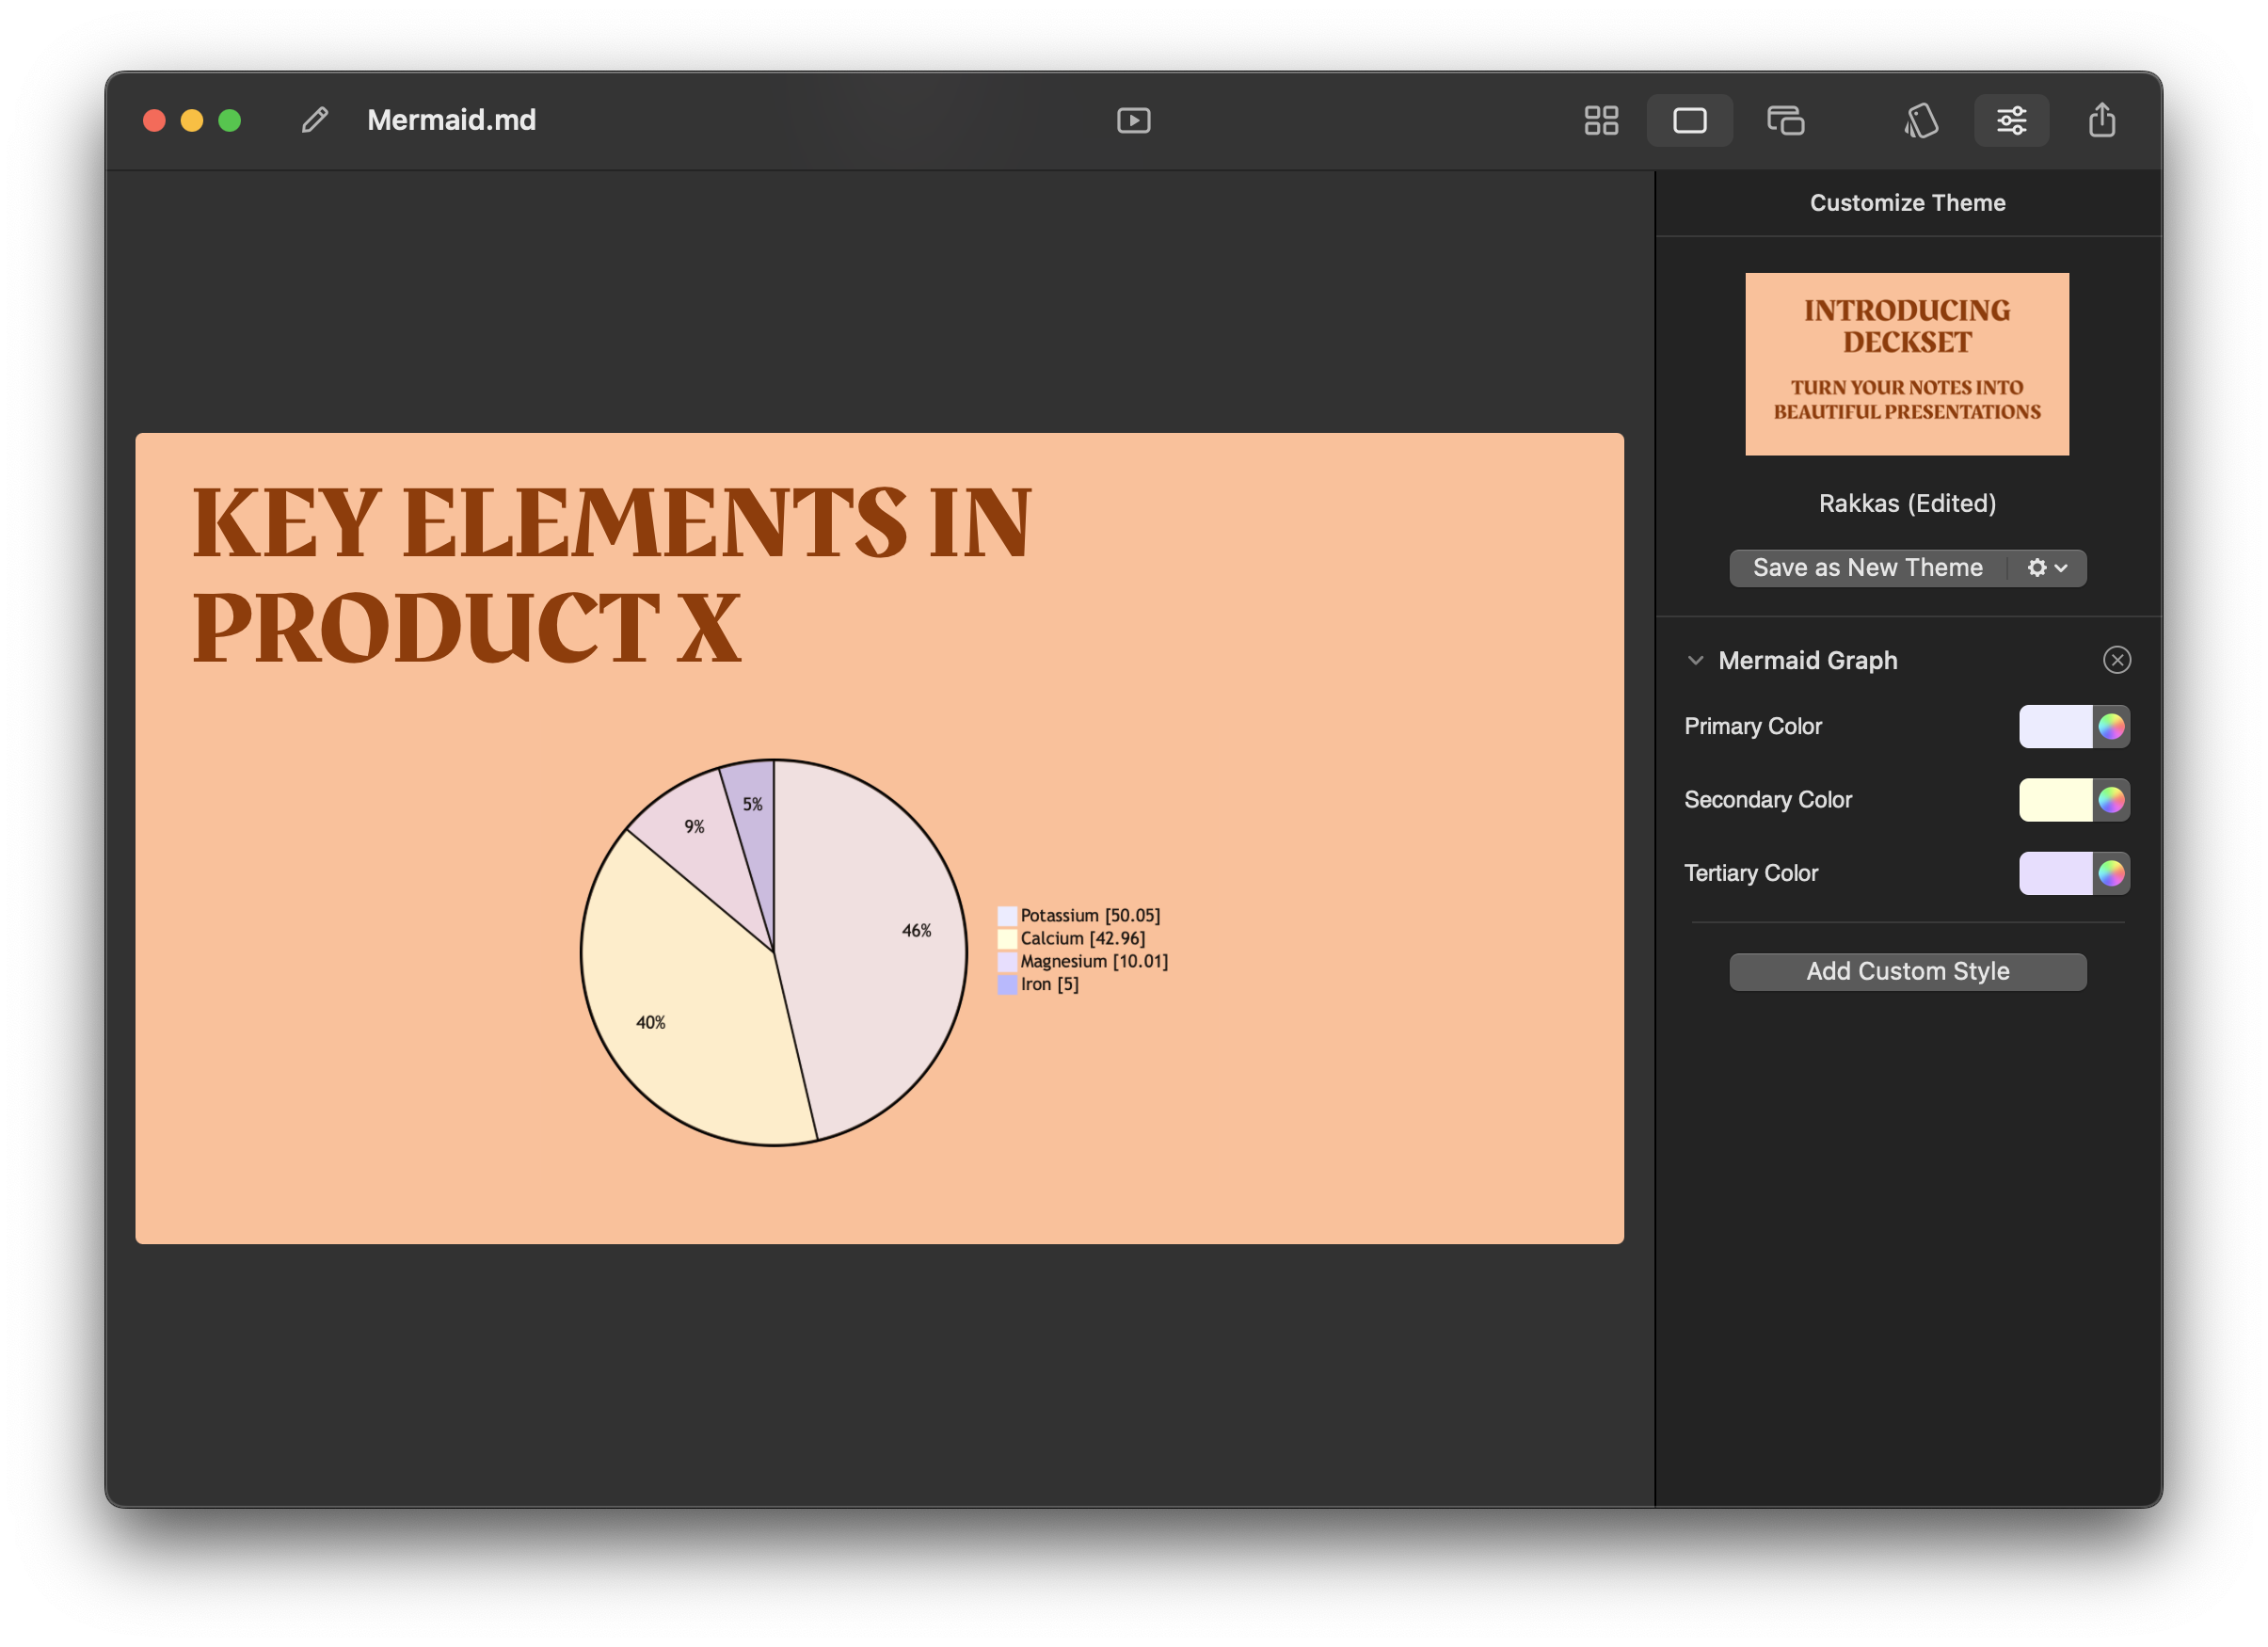
```mermaid
pie showData
    title Key elements in Product X
    "Calcium" : 42.96
    "Potassium" : 50.05
    "Magnesium" : 10.01
    "Iron" :  5
```
You can also use the customization menu to specify base colors for Mermaid graphs:
You can override Mermaid colors per slide with the markdown graph customization command. Provide up to three colors plus an optional dark-mode flag:
[.graph: #ffffff, #aaffff, #000000, dark-mode(false)]
See also Custom theming for more slide-level overrides.
Learn more about available graph types in the Mermaid.js documentation. Zenuml diagrams are not supported yet—let us know via support if you need them.